
What Is the Lessons Dashboard?
The Lessons Dashboard is a tool inside Skyllful Studio that shows how Learners are doing in each Lesson, one step at a time. It helps you find exactly where learners are making mistakes, so you can fix the content before the problem gets worse.
Who Uses It?
Anyone who cares about how well training is working can use the Lessons Dashboard. This includes content creators, program administrators, learning leaders, and key stakeholders.
How to Access It
Navigate to your Learning Program.
On the Learning Program Overview, select the Lessons Dashboard quick link.
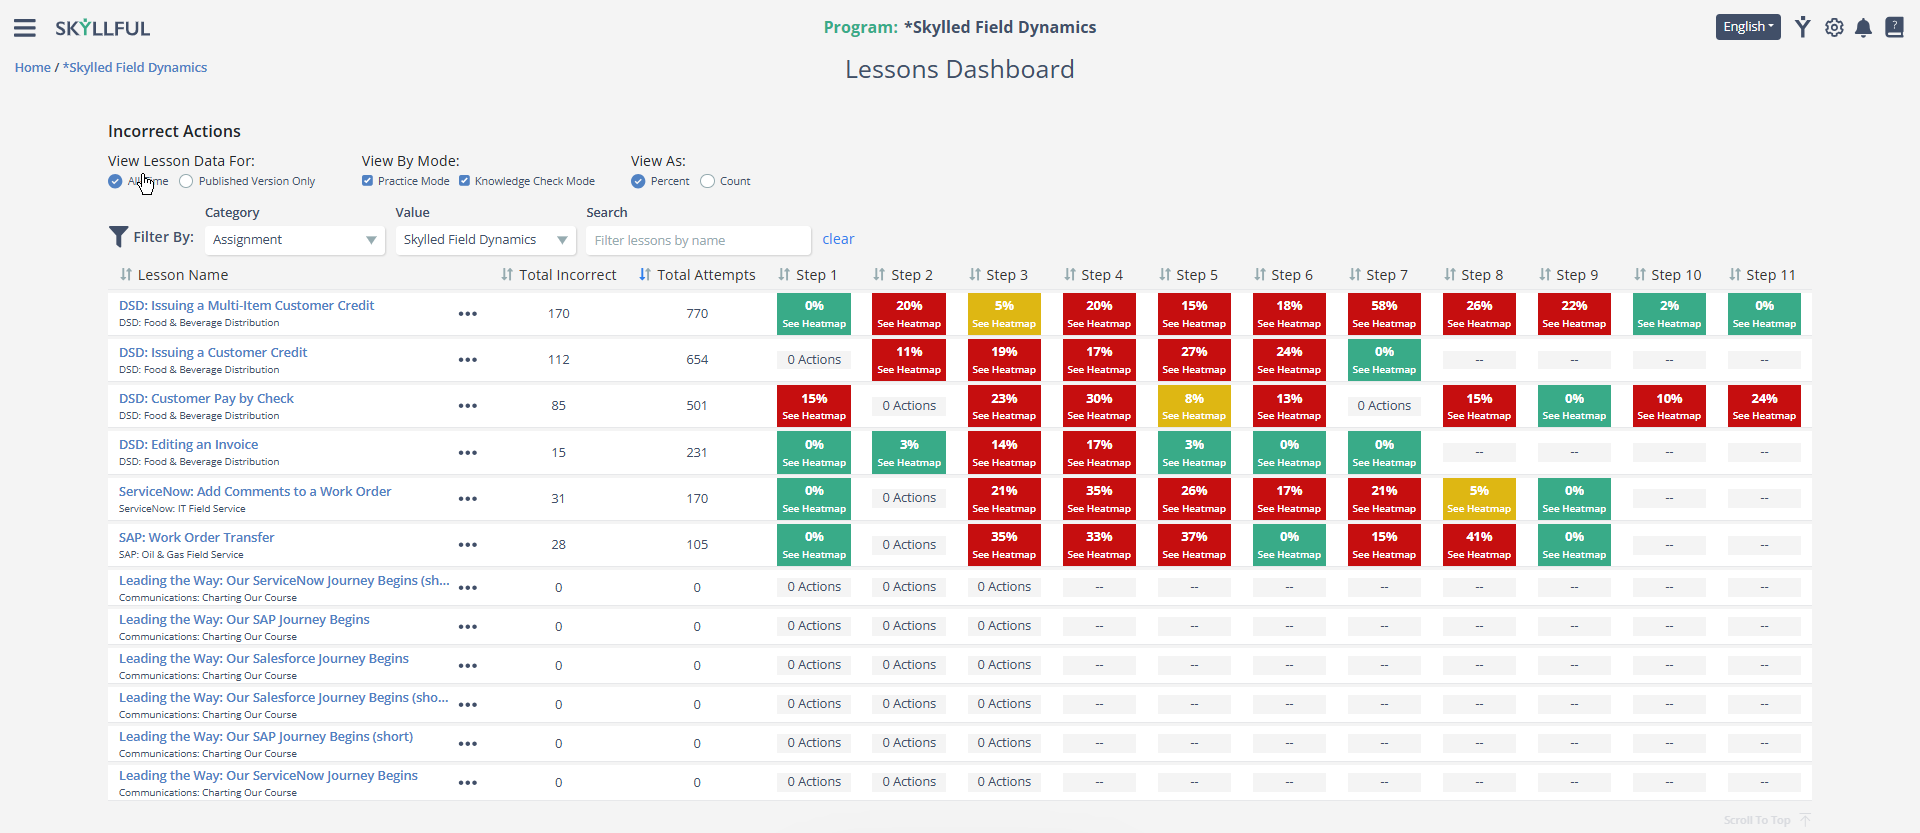
Understanding the Color Coding
Each step in a lesson shows a colored cell with the percentage of incorrect actions at that step. The color tells you at a glance how learners are doing.
Green means most learners are getting this step right.
Yellow means a moderate number of learners are making mistakes here. It is worth a closer look, especially if you see this across multiple lessons or versions.
Red means a high number of learners are struggling at this step. Click the cell to open the Heatmap Viewer and see exactly where learners are tapping on the screen.
0 Actions means no incorrect tap data was recorded for this step. This usually happens on steps that do not require a specific tap, like informational or video steps.
"--" means this step does not exist in that lesson. Lessons have different numbers of steps, so not every column will apply to every lesson.
What's Next
Now that you understand the basics, learn how to filter and adjust the data to focus on what matters most. See Filtering and Viewing Options for details.