In this article, you’ll learn how to use the Assignments Dashboard to customize your view, interpret key performance metrics, and manage assignments with ease.
Dashboard Features and Navigation
The Assignments Dashboard includes interactive elements that give you detailed insights and quick access to additional features and assignment details.
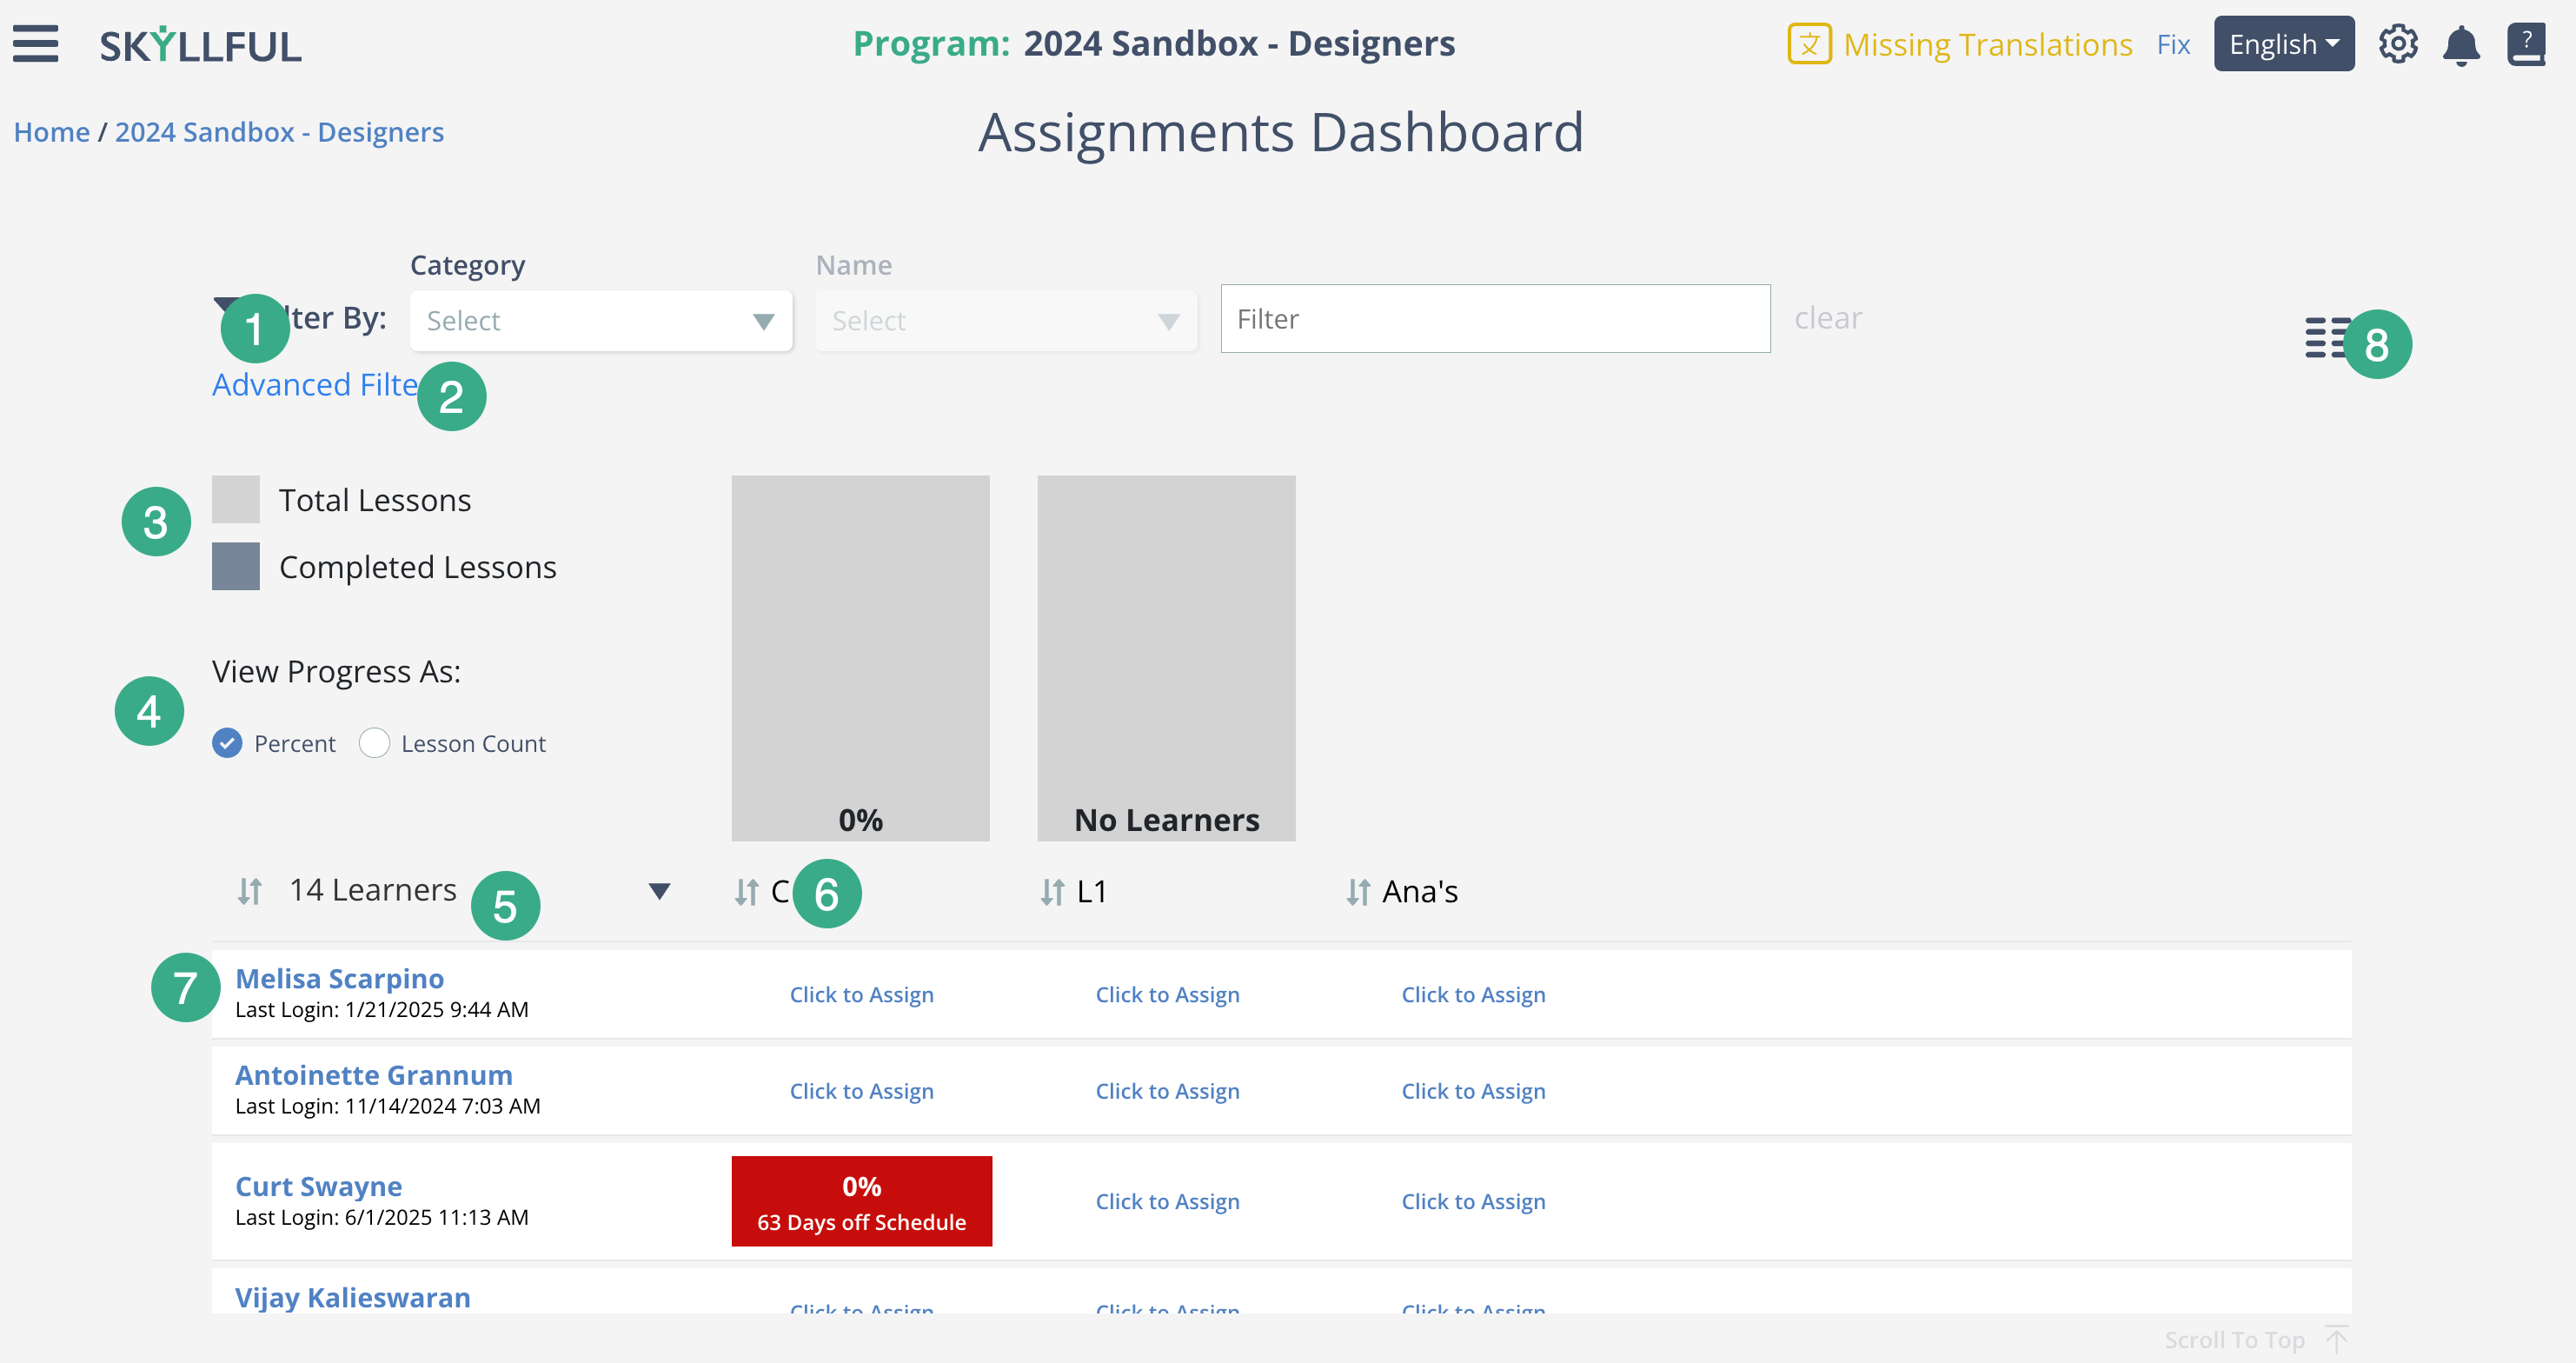
Filter | Advanced Filter | Total Lessons vs Completed Lessons | Progress Display |
|---|---|---|---|
Narrow down your assignment view by tag, learner group, or assignment type. | Apply multiple filters at once for a more detailed, customized view of assignments and learner data. | View how many lessons have been assigned versus how many have been completed across each assignment. | View progress as count of lessons or percentage of lessons complete. |
Total Learners Assigned | Lesson Abbreviation | Learner Detatil | Columns View |
Displays the number of learners included in each assignment. | Displays the number of learners included in each assignment. | Click to view detailed progress, attempts, and status for each learner. | Customize which columns appear in your dashboard to focus on the data that matters most. |
*Reference assignments will not have bar charts.